
НЧИЎФмЙыИЎРЧ НУДыАЁ ГЁГЊАэ, ЛѕЗЮПю ФПЙТДЯЦМ СіПЊРЬ КЮЛѓЧЯДй
| ЙЬБЙ ГЛ ЕЕНУ РЮБИРЧ РЏРдАњ РЏУтПЁ РжОю ЦаХЯ КЏШАЁ РЯОюГЊАэ РжДй. ФкЗЮГЊ19ДТ РЬЗЏЧб ЦаХЯ КЏШИІ ДѕПэ АЁМгШЧЯАэ РжДй. ОюЖВ ЕЕНУПЭ СіПЊПЁ РЮБИАЁ ДУАэ, СжДТАЁ? РЬРЏДТ ЙЋОљРЮАЁ? РЬ.. |
НЧИЎФмЙыИЎРЧ НУДыАЁ ГЁГЊАэ, ЛѕЗЮПю ФПЙТДЯЦМ СіПЊРЬ КЮЛѓЧЯДй
| ЙЬБЙ ГЛ ЕЕНУ РЮБИРЧ РЏРдАњ РЏУтПЁ РжОю ЦаХЯ КЏШАЁ РЯОюГЊАэ РжДй. ФкЗЮГЊ19ДТ РЬЗЏЧб ЦаХЯ КЏШИІ ДѕПэ АЁМгШЧЯАэ РжДй. ОюЖВ ЕЕНУПЭ СіПЊПЁ РЮБИАЁ ДУАэ, СжДТАЁ? РЬРЏДТ ЙЋОљРЮАЁ? РЬ.. |
 |
 |
 |
 |
 |
 |

The Rise of the New American Community
For decades the Trends editors have highlighted the absurdity of the great urbanization trend. So-called experts insisted on conflating the mass flight from rural poverty in the developing world with the continued growth of certain dense urban centers in the OECD countries. Much of the confusion arises from the biases of analysts in parsing the data. For instance, as explained in prior Trends issues the often-quoted assertion that ЁАdense urban areas are exceptionally productiveЁБ in economic terms, turns out to be untrue when the data is accurately parsed.
Nevertheless, for a generation, a procession of pundits, public relations agents, and real estate speculators have promoted the notion that our future lay in dense - and politically deep-blue - urban centers, largely on the coasts. In fact, in the midst of the financial crisis just a decade ago, suburbiaЁЏs future seemed perilous, with experts claiming that many suburban census tracks were about to become ЁАthe next slums.ЁБ Specifically, the head of President ObamaЁЏs Department of Housing and Urban Development proclaimed that ЁАsprawlЁБ was now doomed and people were ЁАmoving back into central cities.ЁБ Of course, that ЁАwisdomЁБ came from the same administration that told us ЁАyou canЁЏt drill your way to energy independenceЁБ and ЁАthose U.S. manufacturing jobs are never coming back.ЁБ
Notably, that idea was always overwrought with enthusiasm. But now, with the COVID-19 pandemic heavily concentrated in these urban centers, the case for forced densification promoted by ЁАurban supremacistsЁБ has lost a lot of its former luster. Why? Because, by some estimates, the death rate in large urban counties has been well over twice those of high-density suburbs, nearly four times higher than lower-density ones, with even larger gaps with smaller metros and rural areas.
The pandemic has been toughest on those areas that suffer what demographer Wendell Cox called ЁАexposure density.ЁБ In the worst case, which is in New YorkЁЏs outer boroughs, this pattern is exacerbated by living in crowded apartments, walking packed streets, traveling cheek-to-jowl in the subway, and then being forced into a crowded workplace. This could explain why sprawling, large, and relatively less-dense urban areas in Texas, California, and Florida - each with its own pockets of poverty - have also experienced far lower infection and fatality rates than New York.
As in so many other aspects of life, the COVID19 crisis has brought to the forefront both threats and opportunities which most people had never considered. And those new insights have combined with well-known concerns to make people rethink many aspects of life. A recent Harris poll suggests that nearly 40% of urban residents are considering a move to a less crowded place. And according to the National Association of Realtors, since the pandemic began, more people are seeking out single-family houses with such things as yards and workspaces.
Mass transit, a critical component in the urban supremacistsЁЏ calculation, seems to be particularly out of favor. Already declining or stagnating around the country before the pandemic, mass transit has taken a particularly nasty hit, with more people than ever looking for alternatives, especially telecommuting. According to Gallup, 60% of people now working from home express a preference to continue to do so for the foreseeable future.
These findings donЁЏt represent a break with the past but rather an acceleration of pre-existing trends. In contrast to 2001, when New York was last under assault, the city is now losing population and suffering mounting out-migration. The same dynamics are already being seen in our two other large metropolitan centers, Chicago and Los Angeles.
Increasingly, migration trends favor sprawling sunbelt cities such as Austin, Dallas, Orlando, and Nashville. And more recently, Americans have been heading to even smaller cities. The fastest growth in domestic migration, notes demographer Wendell Cox, is now to cities with less than a million people, a dramatic change from just a decade ago. In virtually all areas - with the notable exception, at least so far, of New York - an increasing share of population growth has also shifted to suburban locales.
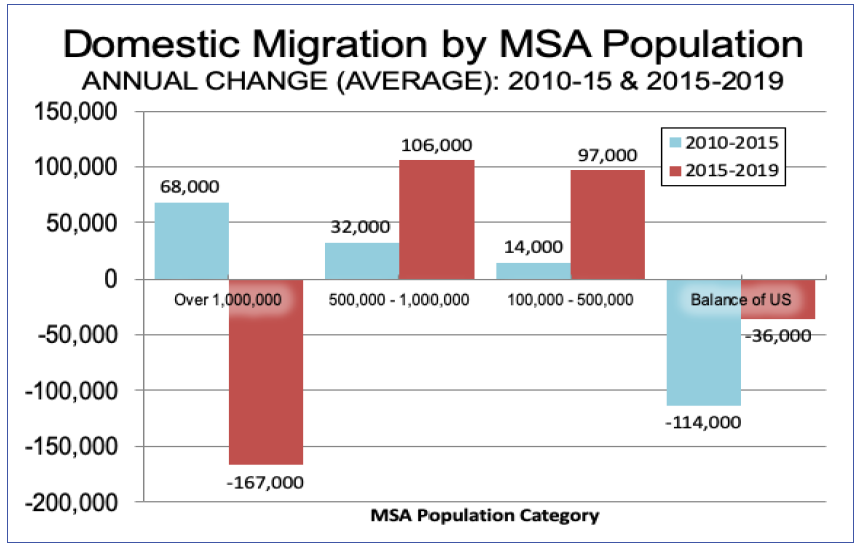
The new data shows that the metropolitan statistical areas (or MSAs) with over 1,000,000 population, have seen their annual net domestic migration plummet from an average annual gain of 68,000 from 2010 to 2015 to an annual loss of 167,000 from 2015 to 2019. Cox recently reported that within these major metropolitan areas, migration has increased strongly from the central to suburban counties. At the same time, smaller MSAs and areas outside MSAs are doing much better. Some of these are in the smallest population categories and are adjacent to the retirement communities that have attracted so many new residents, principally in Florida.
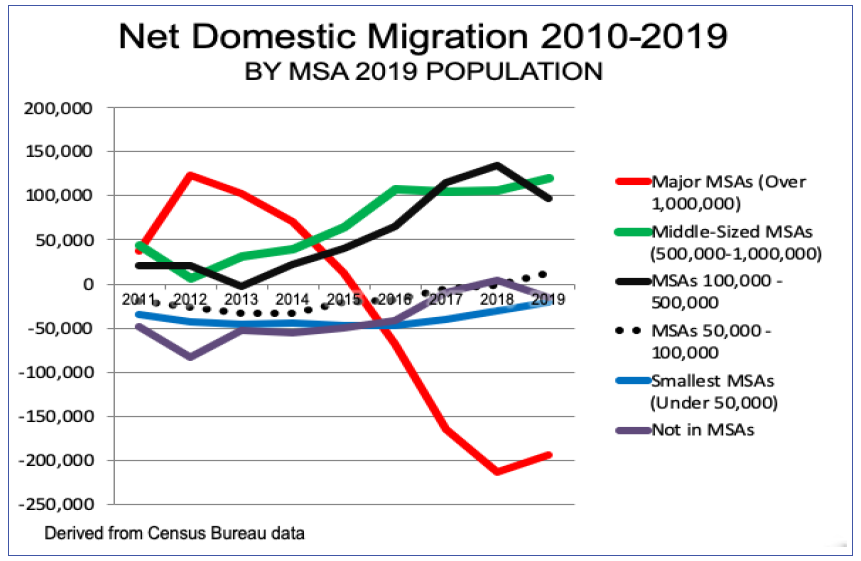
The strongest net domestic migration performance is in MSAs with 500,000 to 1,000,000 in population, and those with 100,000 to 500,000 population have done nearly as well. Both categories have experienced big gains in net domestic migration since 2013.
MSAs with from 50,000 to 100,000 population, which hemorrhaged residents for years, have improved and have begun to gain net domestic migrants.
Meanwhile, MSAs under 50,000 and areas outside MSAs are still suffering modest losses while doing much better than earlier in the decade. Both of the smallest categories are also attracting hundreds of thousands more in net domestic migrants than the largest MSAs.
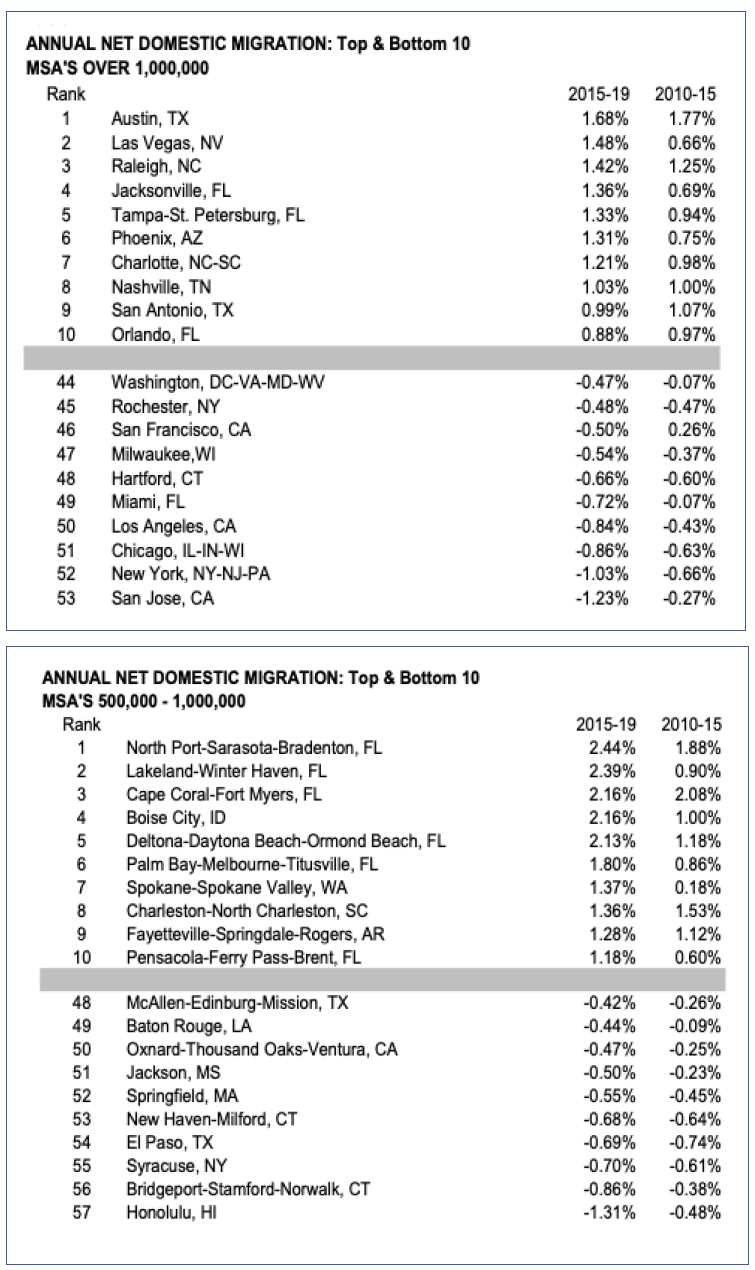
Among AmericaЁЏs 926 MSAs, the ten leading net domestic migration leaders from 2015 to 2019 include none with populations above 500,000. And all ten are in the South or West.
Among the MSAs over 1 million, Austin continues to have the strongest net domestic migration, at 1.68% annually from 2015 to 2019. All but two of the top ten large MSAs were in the South, joined by Las Vegas and Phoenix from the West. And notably, the top 10 had higher annual gains from migration 2015-to-2019 than in 2010-to-2015. In contrast, the bottom 10 had larger net domestic migration losses in 2015-to-2019 than in 2010-2015.
Importantly, the biggest losses were in SanJose, New York, Chicago, Los Angeles, and Miami. That means the five densest major urban areas, as defined by the US Census Bureau (Los Angeles, San Francisco, San Jose, New York, and Miami) are part of this bottom ten.
Notably, five of the six leading gainers among MSAs with 500,000 to 1,000,000 people were in Florida: North Port-Sarasota, Lakeland, Cape Coral, Deltona-Daytona Beach, and Melbourne. These all benefit from low taxes, reasonable housing costs, and being attractive retirement destinations. Nine of the top ten had more annual net domestic migration than in 2010-2015.
Outsides of Florida, the fast-growing mid-sized MSAs Boise, Spokane, Fayetteville (AR) and Charleston (SC) have diversified economies that seem well-positioned for continued growth. Two have particularly strong commercial bases, Fayetteville, is headquarters for (Wal-Mart) the worldЁЏs largest retailer and Charleston has a huge Boeing Assembly plant. Importantly, nine of the top 10 had higher annual net domestic migration in 2015-to-2019 than in 2010-to-2015.
On the contrary, nine of the bottom 10 mid-sized MSAs had larger net domestic migration losses in 2015-to-2019 than in 2010-to-2015. The largest losses were in Honolulu, Bridgeport-Stamford, Syracuse, El Paso, and New Haven.
What about smaller MSAs?
The top MSAs in the 100,000 to 500,000 categories are mostly strong retirement destinations, such as The Villages, FL, Myrtle Beach, SC, Punta Gorda, FL, St. George, UT, and Homosassa Springs, FL.
On the other hand, the top domestic migration gainers in the 50,000 to 100,000 categories are not principally retirement destinations. Eight of the top ten are within commuting distance of large MSAs. For example, the largest gainers were Jefferson, GA (near Atlanta), Granbury, TX (near Dallas-Fort Worth), Fernley, NV (near Reno), and Shelton, WA (near Seattle). Only Cedar City, UT, and Statesboro, GA are not within commuting distance of a larger MSA. And notably, nine of the top 10 MSAs in the 50,000 to 100,000 category had higher annual net domestic migration in 2015-to-2019 than in 2010-to-2015.
The Pacific Northwest dominates the category of fast-growing MSAs under 50,000 people with six of the top ten positions among the smallest MSAs.
WhatЁЏs this telling us?
Even prior to the COVID19 crisis there was an unprecedented switch in growth patterns from the largest metropolitan MSAs to smaller MSAs, as well as areas outside MSAs. Now, with the greater interest in working from home, triggered by virus-related lockdowns, U.S. population dispersion could accelerate further transforming the economic, social, and political dynamics of the nation.
Given this Trend, we offer the following forecasts for your consideration.
First, over at least the next five years, high-cost tech hubs like Silicon Valley, Seattle, and New York City will experience a major exodus of talent.
A recent survey of thousands of San Francisco Bay Area tech workers found that two-thirds would consider leaving the region if they were given the option to work from home permanently. The survey asked 4,400 tech workers including 2,800 in the Bay Area and 1,600 elsewhere for their thoughts on working remotely and how it would affect their choice of where to live. The pandemic has forced companies around the world to abruptly transition to an entirely remote workforce. This has made workers increasingly question whether they want to deal with the high cost of living, a major housing crisis, and terrible traffic. Furthermore, with offices, shops, bars, and other amenities off-limits because of the pandemic, many tech workers say they have no reason to stay and are considering leaving the region, and some real-estate professionals in rival regions have said theyve seen an uptick in interest. Asked whether they would "consider relocating" if, given the option to work from home as much as possible, only 34% of Bay Area respondents said no. About 18% said theyd consider moving out of the metro area but staying in California, 35.7% said theyd consider going elsewhere in the U.S., and just under 16% said theyd consider moving out of the country. Similar results were found for Seattle and New York, two other high-cost metro areas, and tech-industry hubs; there 69.5% and 62.3% of respondents respectively said theyd consider leaving the cities.
Second, California, in particular, will continue its quixotic pursuit of high-density urbanization even as it makes the state ever more unlivable for most people.
California lost 180,000 people in 2018 and 130,000 in 2017 due to state-to-state migration - and 2019 was probably worse. WhatЁЏs happening? Densification policies in the name of ЁАsaving the planetЁБ are driving costs up costs, creating livability crises, and turning California into what demographer Joel Kotkin calls ЁАa 21st-century feudal state.ЁБ Median monthly rent for a Los Angeles one-bedroom apartment is $2,300, while itЁЏs more than $3,400 in San Francisco. Meanwhile, the rental price for a one-bedroom unit is $925 in Las Vegas and $945 in Phoenix. Not surprisingly, the most popular re-location sites for Californians from 2015 to 2017 were Washington, Texas, and Nevada, which do not have an income tax and are inexpensive relative to California. The tech and financial hubs which face wrenching demographic change will be unwilling to abandon their commitment to densification for at least three reasons: (1) A ЁАreligious commitmentЁБ to the ЁАgreen agenda,ЁБ which prevents them from addressing the evidence objectively. (2) The vested interest of home-owning voters in keeping prices extremely high. And (3) the typical unwillingness of human beings to admit that theyЁЏve been wrong.
Third, the dispersion of tech talent to more U.S. locations will invigorate state and local economies across the U.S.
As weЁЏve explained in previous issues, diffusion of the ЁАtech sectorЁБ across the country would allow venture capitalists and entrepreneurs to get more bang for their invested bucks and allow a wider range of people to ЁАcontribute their ideas. The result will be a more inclusive and productive innovation that enriches more people.
Fourth, the post-crisis dispersion of the population will diminish the power and influence of our largest and densest cities. With the exception of the Puget Sound and San Francisco Bay areas, high-end job creation has been shifting to smaller cities like Austin and Raleigh. In addition to trends weЁЏve discussed, most large U.S. cities are now increasingly making a series of unforced errors in social policy. Increasingly radicalized city governments - for example, in Seattle and New York - have pushed new businesses out, with new taxes and regulation. Meanwhile, other policies have created streets filled with homeless people, drug addicts, petty thieves, and even sex offenders.
Fifth, these demographic trends, now accelerated by the COVID19 crisis, will profoundly reshape our political future.
Consider the changing make-up of Congress: in 1950 the Northeast had 115 members of the House, but now it has 78, and will soon lose more. California, another blue area, was a great gainer of seats for well over a century, but it is now growing below the national average, losing population, and likely to lose a seat for the first time. Meanwhile, the red states are gaining seats as follows: Texas picks up three seats; Florida picks up two; Arizona, Montana, and North Carolina get one each. Colorado, which is purple, will add one, and Oregon is the only blue state on the list to get one. Obviously, these changes could help the GOP, but the migration of millennials out of the deep-blue areas could give Democrats hope of moving other states to the left as weЁЏve seen in Colorado. And,
Sixth, regardless of the actions taken by state and local government, the best days for California and New York City real state are behind us.
Like tulip bulbs and dot-com stocks, prices have become decoupled from long-term intrinsic value. Selling now and investing in equities probably makes the most sense. Florida and Texas real estate may also make sense depending on the leverage used.
References
1. The Hill. May 17, 2020. Joel Kotkin. The new geography of America, post-coronavirus.
https://thehill.com/opinion/campaign/498198-the-new-geography-of-america-post-coronavirus
2. Business Insider. May 20, 2020. Rob Price. A survey of thousands of SF Bay Area techies found that 2 out of 3 would consider leaving if they could permanently work remotely.
https://www.businessinsider.com/two-thirds-tech-workers-leaving-sf-bay-area-wfh-blind-2020-5
3. The Daily Caller. May 23, 2020. Chris Whitech. Silicon Valley Giants Are Allowing Staff to Work Remote Permanently. Will Their Workers Flood into Red States?
https://dailycaller.com/2020/05/23/facebook-twitter-employees-work-remotely-leave-california/
4. com. December 19, 2019. Ryan Streeter. Place and the pursuit of happiness, upward mobility, and the American Dream.
https://www.aei.org/articles/place-and-the-pursuit-of-happiness/
5. com. March 25, 2020. Wendell Cox. DOMESTIC MIGRATION TO DISPERSION ACCELERATES (EVEN BEFORE COVID).
https://www.newgeography.com/content/006648-domestic-migration-dispersion-accelerates-even-covid
6. com. March 25, 2020. Joel Kotkin The Coming Age of Dispersion.
http://www.newgeography.com/content/006588-the-coming-age-dispersion
7. com. June 7, 2019. Ryan Streeter. Dynamism for the working class.
https://www.aei.org/articles/dynamism-working-class/

ЙЬБЙ ГЛ ЕЕНУ РЮБИРЧ РЏРдАњ РЏУтПЁ РжОю ЦаХЯ КЏШАЁ РЯОюГЊАэ РжДй. ФкЗЮГЊ19ДТ РЬЗЏЧб ЦаХЯ КЏШИІ ДѕПэ АЁМгШЧЯАэ РжДй. ОюЖВ ЕЕНУПЭ СіПЊПЁ РЮБИАЁ ДУАэ, СжДТАЁ? РЬРЏДТ ЙЋОљРЮАЁ? РЬЗЏЧб ЦаХЯ КЏШДТ ОюЖВ АсАњИІ АЁСЎПУ АЭРЮАЁ?
.png)
АХДы ЕЕНУШРЧ УпММПЁ ДыЧи, МвРЇ РќЙЎАЁЕщРК OECD БЙАЁЕщ ГЛ ЦЏСЄ ЙаС§ЕШ ДыЕЕНУЕщРЬ АшМг МКРхЧЯАэ РжДйДТ БйАХЗЮ, АГЙпЕЕЛѓБЙЕщ ЖЧЧб ЛчЖїЕщРЬ КѓАяЧб ГѓУЬРИЗЮКЮХЭ ДыЕЕНУЗЮ АшМг РЬЕПЧв АЭРЬЖѓАэ СжРхЧиПдДй. БзЗБЕЅ ДыЕЕНУРЧ Л§ЛъМКРЬ Бз Пм СіПЊКИДй ШЎНЧШї ГєРЛБю? БзЗИСіДТ ОЪРК АЭ ААДй. ЕЅРЬХЭИІ КаМЎЧв ЖЇ КаМЎРкРЧ ЦэАпРИЗЮ РЮЧи МіИЙРК ШЅЖѕРЬ ЙпЛ§ЧЯАя ЧЯДТЕЅ, АцСІРћ УјИщПЁМ ЁЎЙаС§ЕШ ЕЕНУ СіПЊРЬ ИХПь Л§ЛъРћЁЏРЬЖѓДТ РкСж РЮПыЕЧДТ СжРхЕЕ БзСп ЧЯГЊДй. НЧСІЗЮ ЕЅРЬХЭАЁ СЄШЎЧЯАд КаМЎЕЧОњРЛ ЖЇ БзАЭРК ЛчНЧРЬ ОЦДб АЭРИЗЮ ЦЧИэЕЧОњДй.
БзЗГПЁЕЕ КвБИЧЯАэ Чб ММДыПЁ АЩУФ РќЙЎАЁ, БЄАэ ШЋКИ БтАќ, КЮЕПЛъ ХѕБтРкЕщРЧ ЧрЗФРК ЙЬЗЁАЁ СжЗЮ ЙаС§ЕШ АїПЁ ? ЦЏШї ЧиОШМБРЛ ГЄ ДыЕЕНУБЧРЧ СпНЩ ЕЕНУ ? РжРНРЛ АСЖЧиПдДй. НЧСІЗЮ, КвАњ 10Гт Рќ БнРЖ РЇБт МгПЁМ БГПм СіПЊРЧ ЙЬЗЁДТ РЇЧшЧи КИПДАэ, РќЙЎАЁЕщРК МіИЙРК БГПм РЮБИ СЖЛч АсАњАЁ ДйРН ННЗГАЁАЁ ОюЕ№АЁ ЕЩ АЭРЮСіИІ ИэШЎЧЯАд КИПЉСиДйАэ СжРхЧпДй. ПРЙйИЖ ЧрСЄКЮРЧ СжХУЕЕНУАГЙпКЮ РхАќРК ЙЋСњМЧЯАд ЛИОю ГЊАЃ ЕЕНУ ПмАћ СіПЊРЬ РЬСІ ЙЎСІПЁ КРТјЧпАэ ЛчЖїЕщРЬ ДыЕЕНУБЧРЧ СпНЩ ЕЕНУЗЮ ДйНУ ШИБЭЧЯАэ РжДйАэ МБО№Чб Йй РжДй. ЧіНЧАњ ДйИЃДйДТ СЁПЁМ РЬДТ ЙЬБЙРЬ ПЁГЪСі ЕЖИГРЛ РЬЗчСі ИјЧв АЭРЬАэ, ЙЬБЙРЧ СІСЖОї РЯРкИЎДТ ДйНУ КЮШяЧЯСі ОЪРЛ АЭРЬЖѓДТ СжРхАњ ХЉАд ДйИЃСі ОЪДй.
ЧіНЧРК ЧіРч ЕЕНУ СпНЩПЁ ФкЗЮГЊ19АЁ ХЉАд С§СпЕЧИщМ ЁЎЕЕНУ ПьПљСжРЧРкЕщЁЏПЁ РЧЧи УЫСјЕШ АэЙаЕЕРЧ ДыЕЕНУДТ РЬРќПЁ ДЉЗШДј БЄХУРЛ РвАэ РжДйДТ ЕЅ РжДй. ИюИю УпСЄПЁ ЕћИЃИщ, ДыЕЕНУРЧ ЛчИСЗќРК АэЙаЕЕ БГПм РЮБИРЧ 2Йш РЬЛѓ, РњЙаЕЕ ЕЕНУКИДй АХРЧ 4Йш Дѕ ГєАэ, РлРК ДыЕЕНУ Йз ГѓУЬ СіПЊАњРЧ АнТїЕЕ РЬКИДй ШЮОР Дѕ ХЋ АЭРИЗЮ ГЊХИГЕДй.
РЮБИЧаРк РЂЕЈ ФлНК(Wendell Cox)АЁ ЁЎГыУт ЙаЕЕ (exposure density)ЁЏЗЮ КЮИЃДТ СіПЊПЁМ ЦвЕЅЙЭРК АЁРх АнЗФЧЯАд РЯОюГЕДй. ДКПхРЧ Чб РкФЁБИПЁМ РЯОюГ УжОЧРЧ ЛчЗЪИІ КИИщ, РЬ ЦаХЯРК КеКёДТ ОЦЦФЦЎПЁМ Л§ШАЧЯАэ, ЛчЖїЕщЗЮ ВЫ Тљ АХИЎИІ АШАэ, СіЧЯУЖПЁМ МЗЮ ЙаТјЧЯАэ, ШЅРтЧб СїОї ЧіРхПЁ УтБйЧв Мі ЙлПЁ ОјДТ ЛѓШВРИЗЮ, ЦвЕЅЙЭ ЛчХТИІ ДѕПэ ОЧШНУХААэ РжДй. РЬЗЮ РЮЧи ХиЛчНК, ФЖИЎЦїДЯОЦ, ЧУЗЮИЎДйПЁ МгЧб, ХЉСіИИ ЛѓДыРћРИЗЮ ЙаЕЕАЁ ГЗРК ЕЕНУ СіПЊРЬ ДКПхКИДй ШЮОР ГЗРК АЈПАЗќАњ ЛчИСЗќРЛ АцЧшЧб РЬРЏИІ МГИэЧв Мі РжДй.
РЮЛ§РЧ ДйИЅ ИЙРК УјИщАњ ИЖТљАЁСіЗЮ, ФкЗЮГЊ19 РЇБтДТ ДыКЮКаРЧ ЛчЖїЕщРЬ АэЗСЧЯСі ОЪОвДј РЇЧшАњ БтШИИІ УжРќЙцРИЗЮ АЁСЎПдДй. УжБй ЧиИЎНК Цњ(Harris poll) СЖЛчПЁ ЕћИЃИщ ЕЕНУ АХСжРкРЧ Ор 40%АЁ Дњ ШЅРтЧб АїРИЗЮ РЬСжЧЯДТ АЭРЛ АэЗСЧЯАэ РжДй. ЙЬ КЮЕПЛъЧљШИ(National Association of Realtors)ПЁ ЕћИЃИщ, ФкЗЮГЊ19АЁ НУРлЕШ РЬШФ Дѕ ИЙРК ЛчЖїЕщРЬ ИЖДчРЬГЊ РлОї АјАЃРЛ АЎУс ДмЕЖ СжХУРЛ УЃАэ РжДй.
ЕЕНУ ПьПљСжРЧРкЕщРЧ АшЛъПЁМ СпПфЧб БИМК ПфМвРЮ ДыСпБГХыРК ЦЏШї Дѕ ЙйЖїСїЧЯСі ОЪРК АЭРЬ ЕШ АЭ ААДй. ЦвЕЅЙЭРЬ ЙпЛ§ЧЯБт РќКЮХЭ РЬЙЬ РќБЙРћРИЗЮ СйАХГЊ СЄУМЕЧОюРжДТ ДыСпБГХыРК ЦЏШї ЦвЕЅЙЭРИЗЮ РЮЧб РчХУБйЙЋЗЮ РЮЧи Дѕ ХЋ ХИАнРЛ РдОњДй. ПЉЗаБтАќ АЖЗДПЁ ЕћИЃИщ, ЧіРч С§ПЁМ РЯЧЯДТ ЛчЖїЕщРЧ 60%АЁ АЁБюПю ЙЬЗЁПЁЕЕ АшМг РЬЗЏЧб БйЙЋ ЧќХТИІ МБШЃЧЯДТ АЭРИЗЮ ГЊХИГЕДй.
РЬЗЏЧб АсАњДТ ОеРИЗЮ Дѕ АЁМгШЕЩ РќИСРЬДй. ДКПхРЬ ХзЗЏ АјАнРЛ ЙоОвДј 2001ГтАњ ДыСЖРћРИЗЮ, РЬ ЕЕНУДТ ЧіРч РЮБИИІ РвАэ РЬСжРВ БоЕюРЛ АоАэ РжДй. НУФЋАэПЭ ЗЮНКОиСЉЗЙНКРЧ ЖЧ ДйИЅ ДыЕЕНУБЧРЧ СпНЩ ЕЕНУПЁМЕЕ ЕПРЯЧб ЧіЛѓРЬ ЙпЛ§ЧЯАэ РжДй.
СЁСЁ Дѕ ДУОюГЊАэ РжДТ РЬЗЏЧб РЬСж АцЧтРК ЛчЖїЕщРЬ ПРНКЦО, ДюЗЏНК, ПУЗЃЕЕ, ГЛНЌКєАњ ААРК ЧоКЕРЬ Рп ЕхДТ ЕЕНУИІ МБШЃЧбДйДТ АЭРЬДй. БзИЎАэ УжБйПЁДТ ЙЬБЙРЮЕщРЬ Дѕ РлРК ЕЕНУЗЮ РЬЕПЧЯАэ РжДй. РЂЕЈ ФлНКПЁ ЕћИЃИщ, ЙЬБЙ ГЛ РЬСжПЁМ АЁРх КќИЃАд МКРхЧЯДТ ОчЛѓРК 1ЙщИИ Иэ РЬЧЯРЧ ЕЕНУЗЮ РЬСжЧЯДТ АЭРЬДй. РћОюЕЕ СіБнБюСі ДКПхРЛ СІПмЧЯАэДТ АХРЧ И№Еч СіПЊПЁМ РЮБИ СѕАЁРВРЛ КИРЮ АїРК РЬЗЏЧб БГПм СіПЊЕщРЬОњДй.
ЛѕЗЮПю ЕЅРЬХЭПЁ ЕћИЃИщ РЮБИ 1ЙщИИ Иэ РЬЛѓРЧ MSAs(metropolitan statistical areas, ДыЕЕНУБЧ)ДТ 2010Ё2015ГтПЁДТ ПЌЦђБе 68,000ИэРЬ Дѕ РЏРдЕЧОњСіИИ, 2015Ё2019ГтПЁДТ ПЌЦђБе 167,000ИэРЬ Дѕ РЏУтЕЧИщМ ПЌАЃ Мј РЏРдЗќ БоАЈРЛ АоАэ РжДй. РЂЕЈ ФлНКДТ УжБй РЬЗЏЧб СжПф ДыЕЕНУБЧ ГЛПЁМ БГПм МвЧќ ДыЕЕНУГЊ ФЋПюЦМЗЮРЧ РЬСжАЁ ХЉАд СѕАЁЧпДйАэ ЙрЧћДй.

АЁРх АЗФЧб КЏШДТ 50ИИЁ100ИИ ИэРЧ РЮБИИІ АЁСј MSAsПЁМ СжЗЮ РЯОюГЕДй. 10ИИЁ50ИИ ИэРЧ РЮБИИІ АЁСј MSAsЕЕ АХРЧ ИЖТљАЁСіПДДй. РЬ ЕЮ ЙќСжПЁМ 2013Гт РЬШФ Мј РЮБИ РЏРдРЛ АцЧшЧЯАэ РжДй.
МіГт ЕПОШ СжЙЮРЛ РвОњДј 5ИИЁ10ИИ Иэ РЮБИРЧ MSAsДТ Мј РЮБИ РЏРдРЬ АГМБЕЧБт НУРлЧпДй. 5ИИ Иэ РЬЧЯРЧ MSAsПЭ РЬЗЏЧб MSAs ПмКЮДТ ПЉРќШї ??ОрАЃРЧ РЏУтРЛ АоАэ РжСіИИ 10Гт РќКИДйДТ ШЮОР ГЊРК ЛѓШВРЬДй. РЬПЭ ААРК АЁРх РлРК БдИ№РЧ MSAsДТ ДыБдИ№ MSAsКИДй Мј РЮБИ РЏРдПЁ РжОю РќУМРћРИЗЮ МіНЪ ИИ ИэРЛ ШэМіЧЯАэ РжДй.
ЙЬБЙ ГЛ Уб 926АГРЧ MSA Сп, 2015ГтКЮХЭ 2019ГтБюСі Мј РЏРд РЮБИ 10РЇБЧПЁ 50ИИ Иэ РЬЛѓРЧ РЮБИИІ АЁСј АїРК ОјДй. БзИЎАэ 10РЇБЧ MSA И№ЕЮ ГВКЮПЭ МКЮПЁ РЇФЁЧиРжДй.
1ЙщИИ Иэ РЬЛѓРЧ РЮБИИІ АЁСј MSA Сп, ПРНКЦОРК 2015ГтКЮХЭ 2019ГтБюСі ИХГт 1.68%ЗЮ АЁРх АЗТЧб Мј РЏРдЗќРЛ АшМг РЏСіЧЯАэ РжДй. ЛѓРЇ 10АГ MSA Сп 2АГИІ СІПмЧб ГЊИгСіДТ И№ЕЮ МКЮРЧ ЖѓНККЃРЬАХНКПЭ ЧЧДаНКПЭ ЧдВВ ГВКЮПЁ РЇФЁЧи РжДй. ЦЏШї ЛѓРЇ 10РЇБЧРК 2010Ё2015ГтПЁ КёЧи 2015Ё2019ГтПЁ Дѕ ГєРК ПЌАЃ РЏРдЗќРЛ КИПДДй. РЬПЭ ДыСЖРћРИЗЮ, ЧЯРЇ 10РЇБЧРК 2010Ё2015 ГтПЁ КёЧи 2015Ё2019Гт ЛчРЬПЁ Мј РЏУтРЬ Дѕ ФЧДй.
СпПфЧб АЭРК ЛъШЃММ, ДКПх, НУФЋАэ, ЗЮНКОиСЉЗЙНК, ИЖРЬОжЙЬПЁМ АЁРх ХЋ РЏУтРЬ РЯОюГЕДйДТ СЁРЬДй. РЬДТ ЙЬ РЮБИСЖЛчБЙПЁ РЧЧи СЄРЧЕШ 5Ды СжПф ЕЕНУ СіПЊРЮ ЗЮНКОиСЉЗЙНК, ЛїЧСЖѕНУНКФк, ЛъШЃММ, ДКПх, ИЖРЬОжЙЬАЁ РЬЗЏЧб ЧЯРЇ 10АГПЁ МгЧбДйДТ АЭРЛ РЧЙЬЧбДй.
.png)
ЦЏШї, 50ИИЁ1ЙщИИ ИэРЧ РЮБИИІ КИРЏЧб MSA Сп 6АГ ИЎЕљ СіПЊРЧ 5АГАЁ ЧУЗЮИЎДйПЁ РжДй. ЙйЗЮ ГыНК ЦїЦЎ-ЛѕЗЏМвХИ(North Port-Sarasota), ЗЙРЬХЉЗЃЕх(Lakeland), ФЩРЬЧС ФкЗВ(Cape Coral), ЕЈХфГЊ ЕЅРЬХфГЊ КёФЁ(Deltona-Daytona Beach), ИсЙј(Melbourne)РЬДй. РЬ И№Еч АїЕщРЬ РњЗХЧб ММБн, ЧеИЎРћРЮ СжХУКёПы, ИХЗТРћРЮ РКХ№ АХСжСіЖѓДТ РЬСЁРЛ АЎАэ РжДй.
ЧУЗЮИЎДй РЬПмРЧ СіПЊПЁМ КќИЃАд МКРхЧЯДТ СпАЃ БдИ№РЧ MSAРЮ КИРЬНУ(Boise), НКЦїФЕ(Spokane), ЦфРЬПЇКє(Fayetteville, AR), ТћНКХЯ(Charleston, SC)РК СіМгРћРЮ МКРхРЛ РЇЧи АцСІ ПЉАЧРЛ ДйАЂШЧпДй. ЕЮ АїРК ЦЏШї АЗТЧб ЛѓОї БтЙнРЛ КИРЏЧЯАэ РжРИИч, ЦфРЬПЇКєРК ММАш УжДы МвИХОїУМ ПљИЖЦЎРЧ КЛЛчРЬИч ТћНКХЯРК АХДыЧб КИРз СЖИГ АјРхРЛ КИРЏЧЯАэ РжДй. СпПфЧб АЭРК ЛѓРЇ 10АГ Сп 9АГАЁ 2010Ё2015ГтКИДй 2015Ё2019ГтПЁ ПЌАЃ Мј РЏРдЗќРЬ Дѕ ГєОвДйДТ СЁРЬДй.
ЙнДыЗЮ, ЧЯРЇ 10Ды СпМв БдИ№ MSA Сп 9АГДТ 2010Ё2015ГтКИДй 2015Ё2019ГтПЁ Дѕ ХЋ РЮБИ РЏУтРЛ АцЧшЧпДй. АЁРх ХЋ МеНЧРЛ РдРК АїРК ШЃГюЗъЗч(Honolulu), КъИЎСіЦїЦЎ-НКХЦЦїЕх(Bridgeport-Stamford), НУЗЏХЅНК(Syracuse), ПЄЦаМв(El Paso), ДК ЧьРЬКь(New Haven)РЬОњДй.
БзЗИДйИщ РЬКИДй Дѕ РлРК MSAДТ ОюЖАЧвБю?
10ИИЁ50ИИРЧ РЮБИ КИРЏ ЙќСж Сп ЛѓРЇ MSAДТ ЧУЗЮИЎДйРЧ Дѕ КєИЎСі(The Villages), ЧЌХИ АэИЃДй(Punta Gorda), ШЃИ№ЛчЛч НКЧСИЕНК(Homosassa Springs), ЛчПьНК ФГЗбЖѓРЬГЊРЧ ИгЦВ КёФЁ(Myrtle Beach, SC), РЏХИРЧ ММРЮЦЎ СЖСі(St. George)ПЭ ААРК ДыКЮКа АЗТЧб РКХ№ АХСжСіРЬДй. ЙнИщ, 5ИИПЁМ 10ИИ Иэ РЮБИ КИРЏ ЙќСж Сп ЛѓРЇ СіПЊРК СжЗЮ РКХ№ АХСжСіДТ ОЦДЯДй. ЛѓРЇ 10АГ Сп 8АГДТ КИДй ХЋ MSAПЭ ХыБй АХИЎ ГЛ РЇФЁЧиРжДй. ПЙИІ ЕщОю, АЁРх ХЋ РЮБИ РЏРдРЛ КИРЮ АїРК ОжЦВЖѕХИ КЮБйРЧ СІЦлНМ(Jefferson), ДюЗЏНК ЦїЦЎПіНК(Dallas-Fort Worth) КЮБйРЧ БзЗЃЙіИЎ(Granbury), ИЎГы(Reno) КЮБйРЧ ЦнИЎ(Fernley), НУОжЦВ КЮБйРЧ МПЦА(Shelton)РЬДй. РЏХИРЧ Дѕ НУЦМ(Cedar City)ПЭ СЖСіОЦРЧ НКХзРЬУїЙіЗЮ(Statesboro)ИИРЬ КИДй ХЋ MSAПЭ ХыБй АХИЎ ГЛПЁ РЇФЁЧи РжСі ОЪДй. ЦЏШї, 5ИИПЁМ 10ИИ Иэ РЮБИ КИРЏ ФЋХзАэИЎПЁМ ЛѓРЇ 10АГ MSA Сп 9АГАЁ 2010Ё2015ГтКИДй 2015Ё2019ГтПЁ ПЌАЃ Мј РЏРдРЬ Дѕ ГєОвДй.
ЦлНУЧШ ГыНКПўНКЦЎ(The Pacific Northwest)ДТ АЁРх РлРК MSA ЛѓРЇ 10АГ Сп 6АГИІ КИРЏЧб 5ИИ Иэ ЙЬИИРЧ АЁРх КќИЃАд МКРхЧЯДТ MSAИІ АЎАэ РжДй.
РЬЗЏЧб ЛчНЧЕщРК ПьИЎПЁАд ЙЋОљРЛ ИЛЧЯДТ АЭРЯБю?
ФкЗЮГЊ19 РЇБт РЬРќПЁЕЕ АЁРх ХЋ ДыЕЕНУБЧРЧ MSAПЁМ КИДй РлРК MSA ШЄРК MSA ПмАћ СіПЊРИЗЮ РЮБИАЁ РЬЕПЧЯДТ РќЗЪАЁ ОјОњДТ ЁЎЦаХЯ РќШЏЁЏРЬ РжОњДй. УжБйПЁ РЬИЃЗЏ ЙйРЬЗЏНКПЭ АќЗУЕШ СіПЊ ЦѓМтЗЮ РЮЧи РчХУБйЙЋПЁ ДыЧб АќНЩРЬ ГєОЦСіИщМ ЙЬБЙ ГЛ РЮБИ КаЛъРЬ АЁМгШЕЧОњДй. БзИЎАэ РЬДТ БЙАЁ АцСІ, ЛчШИ, СЄФЁ ПЊЧаПЁ ОеРИЗЮ Дѕ ХЋ КЏШАЁ РЯОюГЏ АЭРЛ ПЙАэЧЯАэ РжДй.
РЬЗЏЧб ЦаХЯ РќШЏПЁ ЕћЖѓ ПьИЎДТ ЧтШФ ДйРНАњ ААРК ПЙУјРЛ ГЛЗС КЛДй.
УЙТА, ЧтШФ 5Гт ЕПОШ, НЧИЎФм ЙыИЎ, НУОжЦВ, ДКПхАњ ААРК АэКёПы БтМњ ЧуКъДТ РЮРчЕщРЧ ДыБдИ№ РЏУтРЛ АцЧшЧв АЭРЬДй.
ЛїЧСЖѕНУНКФк КЃРЬ СіПЊРЧ МіУЕ ИэРЧ БтМњСї СОЛчРкЕщПЁ ??ДыЧб УжБй СЖЛчПЁ ЕћИЃИщ, РЬЕщ Сп 3КаРЧ 2АЁ РкХУПЁМ ПЕБИРћРИЗЮ РЯЧв Мі РжДТ ПЩМЧРЬ СжОюСіИщ РЬ СіПЊРЛ ЖАГЏ АЭРЛ АэЗСЧЯДТ АЭРИЗЮ ГЊХИГЕДй. РЬ СЖЛчДТ КЃРЬ СіПЊРЧ 2,800ИэАњ Бз Пм ДйИЅ СіПЊРЧ 1,600ИэРЛ ЦїЧдЧи 4,400ИэРЧ БтМњСї СОЛчРкЕщПЁАд ПјАн БйЙЋПЁ ДыЧб Л§АЂАњ БзАЭРЬ АХСжСі МБХУПЁ ОюЖВ ПЕЧтРЛ ЙЬФЁДТСіИІ ЙЏДТ АЭРЬОњДй. ФкЗЮГЊ19ЗЮ РЮЧи Рќ ММАш БтОїЕщРК АЉРкБт ПјАн БйЙЋЗЮ ДыРРЧпДй. РЬЗЮ РЮЧи БтМњ СОЛчРкЕщРК ГєРК Л§ШАКёПЭ РгДыЗс, ВћТяЧб БГХы ЛѓШВПЁ ДыЧи СЁСЁ Дѕ РЧЙЎРЛ АЎАд ЕЧОњДй. ЖЧЧб ЦвЕЅЙЭРИЗЮ РЮЧи ЛчЙЋНЧ, ЛѓСЁ, Йй Йз БтХИ ЦэРЧ НУМГРЬ БтЧбОјРЬ ЙЎРЛ ДнРИИщМ ИЙРК БтМњСї СОЛчРкЕщРК РЬ СіПЊПЁ ИгЙЋИІ РЬРЏАЁ ОјОю ЖАГЏ АЭРЛ АэЗСЧЯАэ РжДй. РкХУПЁМ БйЙЋЧв Мі РжДТ ПЩМЧРЬ СжОюСіДТ АцПь, РЬСжИІ Л§АЂЧв АЭРЮСі ЙЏРк РРДфРк Сп 34%ИИРЬ ЁЎОЦДЯПРЁЏЖѓАэ ДыДфЧпАэ, 18%ДТ ДыЕЕНУИІ ЖАГЊЕЧ ФЖИЎЦїДЯОЦПЁДТ ИгЙЋИЃДТ АЭРЛ АэЗСЧбДйАэ РРДфЧпАэ, 35.7%ДТ ЙЬБЙРЧ ДйИЅ СіПЊРИЗЮ ПХБтДТ АЭРЛ АэЗСЧбДйАэ ДфЧпДй. 16% ЙЬИИРК БЙПмЗЮ РЬЛчЧЯДТ АЭРЛ АэЗСЧбДйАэ РРДфЧпДй. НУОжЦВАњ ДКПх, ДйИЅ ЕЮ АГРЧ АэКёПы ДыЕЕНУ СіПЊАњ БтМњ ЛъОї ЧуКъПЁМЕЕ КёНСЧб АсАњАЁ ГЊПдДй. РРДфРкРЧ 69.5%ПЭ 62.3%АЁ ЕЕНУИІ ЖАГЏ АЭРЛ АэЗСЧв АЭРЬЖѓАэ ДфЧпДй.
ЕбТА, ДыКЮКаРЧ ЛчЖїЕщПЁАд Дѕ АХСжЧЯБт ШћЕч АїРЬ ЕЧДѕЖѓЕЕ, ФЖИЎЦїДЯОЦДТ БзЕщИИРЧ АэЙаЕЕ ЕЕНУШИІ АшМг УпСјЧв АЭРЬДй.
ФЖИЎЦїДЯОЦДТ РЮБИАЁ ДйИЅ СжЗЮ РЬСжЧЯИщМ 2018ГтПЁ 18ИИ Иэ, 2017ГтПЁ 13ИИ ИэРЧ РЏУтРЛ АцЧшЧпАэ, 2019ГтРК РЏУтРК ОЦИЖЕЕ Дѕ СѕАЁЧпРЛ АЭРЬДй. ЁАСіБИИІ БИЧбДйЁБДТ ИэКЙ ЧЯРЧ ДыЕЕНУБЧ СпНЩ ЕЕНУ АэЙаЕЕ СЄУЅРК АЂСО КёПыРЛ СѕАЁНУХААэ, АХСж РћЧеМК РЇБтИІ РЯРИФбПдДй. РЬДТ ФЖИЎЦїДЯОЦИІ РЮБИЧаРк СЖПЄ ФкЦЎХВ(Joel Kotkin)РЬ ИЛЧЯДТ ЁЎ21 ММБт КРАЧ БЙАЁЁЏЗЮ ИИЕхДТ АЭРЬДй. ЗЮНКОиСЉЗЙНК 1 КЃЕхЗы ОЦЦФЦЎРЧ Пљ ЦђБе РгДыЗсДТ 2,300ДоЗЏРЬАэ, ЛїЧСЖѕНУНКФкПЁМДТ 3,400ДоЗЏАЁ ГбДТДй. ЧбЦэ, 1 КЃЕхЗы БтСиРЧ РгДы АЁАнРК ЖѓНККЃРЬАХНКПЁМДТ 925ДоЗЏ, ЧЧДаНКПЁМДТ 945ДоЗЏРЬДй. ДчПЌШї 2015Ё2017ГтБюСі ФЖИЎЦїДЯОЦ СжЙЮЕщПЁАд АЁРх РЮБтРжДТ РЬСжСіДТ ПіНЬХЯ, ХиЛчНК, ГзЙйДйЗЮ, РЬАїРК МвЕцММАЁ ОјАХГЊ ФЖИЎЦїДЯОЦПЁ КёЧи РњЗХЧЯДй. БзЗЏГЊ РЬЗИАд НЩАЂЧб РЮБИ КЏШПЁ СїИщЧЯАэ РжРНПЁЕЕ БтСИ ЁЎБтМњ Йз БнРЖ ЧуКъЁЏДТ АэЙаЕЕШИІ ЦїБтЧЯСі ОЪРЛ АЭРИЗЮ КИРЮДй.
МТТА, ЙЬБЙ ГЛ Дѕ ИЙРК СіПЊРИЗЮ БтМњ РЮРчЕщРЛ КаЛъНУХАДТ АЭРЬ ЙЬБЙ РќПЊРЧ Сж Йз СіЙц АцСІПЁ ШАБтИІ КвОю ГжРЛ АЭРЬДй.
ЙЬ РќПЊРИЗЮ ЁЎБтМњ РЮРчЕщПЭ БзПЁ ЕћИЅ КЮЙЎЕщЁЏРЬ ШЎЛъЕЧИщ КЅУГ РкКЛАЁПЭ БтОїАЁДТ ХѕРк ДыКё Дѕ ИЙРК БтШИИІ ШЎКИЧв Мі РжАэ, Дѕ ИЙРК ЛчЖїЕщРЬ ЛѕЗЮПю ОЦРЬЕ№ОюПЁ ТќПЉЧЯАэ БтПЉЧв Мі РжДй. Бз АсАњ Дѕ ИЙРК ЛчЖїЕщПЁАд ЧГПфАЁ КаЙшЕЧАэ, КИДй ЦїА§РћРЬАэ Л§ЛъРћРЮ ЧѕНХРЬ РЬЗчОюСњ ШЎЗќРЬ ГєДй.
ГнТА, ФкЗЮГЊ19 РЇБт РЬШФПЁ ЙпЛ§ЧЯДТ КЛАнРћРЮ РЮБИ КаЛъРЬ АЁРх ХЉАэ ЙаЕЕАЁ ГєРК ДыЕЕНУРЧ ШћАњ ПЕЧтЗТРЛ АЈМвНУХГ АЭРЬДй.
ЧЊСЃ ЛчПюЕх(Puget Sound)ПЭ ЛїЧСЖѕНУНКФк КЃРЬ(San Francisco Bay) СіПЊРЛ СІПмЧЯАэ АэБо РЯРкИЎ УЂУт ЧіЛѓРК ПРНКЦО(Austin) Йз ЗбИЎ(Raleigh)ПЭ ААРК МвБдИ№ ЕЕНУЗЮ РЬЕПЧЯАэ РжДй. ДѕКвОю ДыКЮКаРЧ ЙЬБЙ ДыЕЕНУЕщРК ЛчШИ СЄУЅПЁ РжОю ЙйЖїСїНКЗДСі ОЪРК РЯЗУРЧ ГэРяРЛ ОпБтЧЯАэ РжДй. ПЙИІ ЕщОю НУОжЦВАњ ДКПхАњ ААРК СјКИ МКЧтРЧ Сж СЄКЮДТ ЛѕЗЮПю ММБнАњ БдСІИІ АшМг ИИЕщОю НКХИЦЎОї БтОїЕщРЬ РЯРИХГ ЛѕЗЮПю ? ШЄРК ОеРИЗЮ ЙпЛ§Чв - КёСюДЯНКИІ ЙлРИЗЮ ЙаОюГЛДТ АцЧтРЬ РжДй.
ДйМИТА, ЧіРч ФкЗЮГЊ19ЗЮ ДѕПэ АЁМгШЕШ РЬЗЏЧб РЮБИХыАшЧаРћ ЦЎЗЛЕхАЁ ЙЬБЙРЧ СЄФЁРћ ЙЬЗЁИІ ХЉАд ЙйВу ГѕРЛ АЭРЬДй.
ПьМБ РЧШИ БИМКРЧ КЏШИІ ЛьЦьКИРк. 1950ГтПЁ КЯЕПКЮПЁДТ 115ИэРЧ РЧПјРЬ РжОњСіИИ СіБнРК 78ИэРЬ РжРИИч ОеРИЗЮ СТМЎРЛ Дѕ РвАд ЕЩ АЭРЬДй. РќХыРћРИЗЮ ЙЮСжДчРЬ АММИІ КИПЉ ПТ ФЖИЎЦїДЯОЦДТ Чб ММБт ГбАд ИЙРК СТМЎРЛ ШЎКИЧЯАэ РжОњСіИИ РЬСІДТ РќБЙ ЦђБе РЬЧЯРЧ МКРхРИЗЮ РЮБИАЁ РЏУтЕЧОю БтСИ СТМЎРЛ КИСИЧЯБт ШћЕщ АЁДЩМКРЬ ГєДй. ЧбЦэ, ЧУЗЮИЎДйДТ СТМЎРЬ 2АГ ДУОюГЊАэ, ОжИЎСЖГЊ, ИѓХТГЊ, ГыНК ФГЗбЖѓРЬГЊ, ФнЗЮЖѓЕЕ, ПРЗЙАяРК СТМЎРЛ 1АГ Дѕ ДУИБ Мі РжДй. РЬЗЏЧб КЏШДТ ХЉСі ОЪРК АЭ ААСіИИ, РќУМРћРЮ РЧПј БИМКАњ СіСі СЄДчРЧ РЬЧиАќАшИІ ДыРдЧЯИщ СЄФЁРћ КЏШРЧ ДмУЪАЁ ЕЩ Мі РжДй. ОюЖВ СЄДчПЁАд РЬРЭРЬ ЕЩ АЭРЮСіИІ ЧтШФ СіФбКСОп Чв АЭРЬДй.
* *
?
References List :
1. The Hill. May 17, 2020. Joel Kotkin. The new geography of America, post-coronavirus.
https://thehill.com/opinion/campaign/498198-the-new-geography-of-america-post-coronavirus
2. Business Insider. May 20, 2020. Rob Price. A survey of thousands of SF Bay Area techies found that 2 out of 3 would consider leaving if they could permanently work remotely.
https://www.businessinsider.com/two-thirds-tech-workers-leaving-sf-bay-area-wfh-blind-2020-5
3. The Daily Caller. May 23, 2020. Chris Whitech. Silicon Valley Giants Are Allowing Staff to Work Remote Permanently. Will Their Workers Flood into Red States?
https://dailycaller.com/2020/05/23/facebook-twitter-employees-work-remotely-leave-california/
4. com. December 19, 2019. Ryan Streeter. Place and the pursuit of happiness, upward mobility, and the American Dream.
https://www.aei.org/articles/place-and-the-pursuit-of-happiness/
5. com. March 25, 2020. Wendell Cox. DOMESTIC MIGRATION TO DISPERSION ACCELERATES (EVEN BEFORE COVID).
https://www.newgeography.com/content/006648-domestic-migration-dispersion-accelerates-even-covid
6. com. March 25, 2020. Joel Kotkin The Coming Age of Dispersion.
http://www.newgeography.com/content/006588-the-coming-age-dispersion
7. com. June 7, 2019. Ryan Streeter. Dynamism for the working class.
https://www.aei.org/articles/dynamism-working-class/